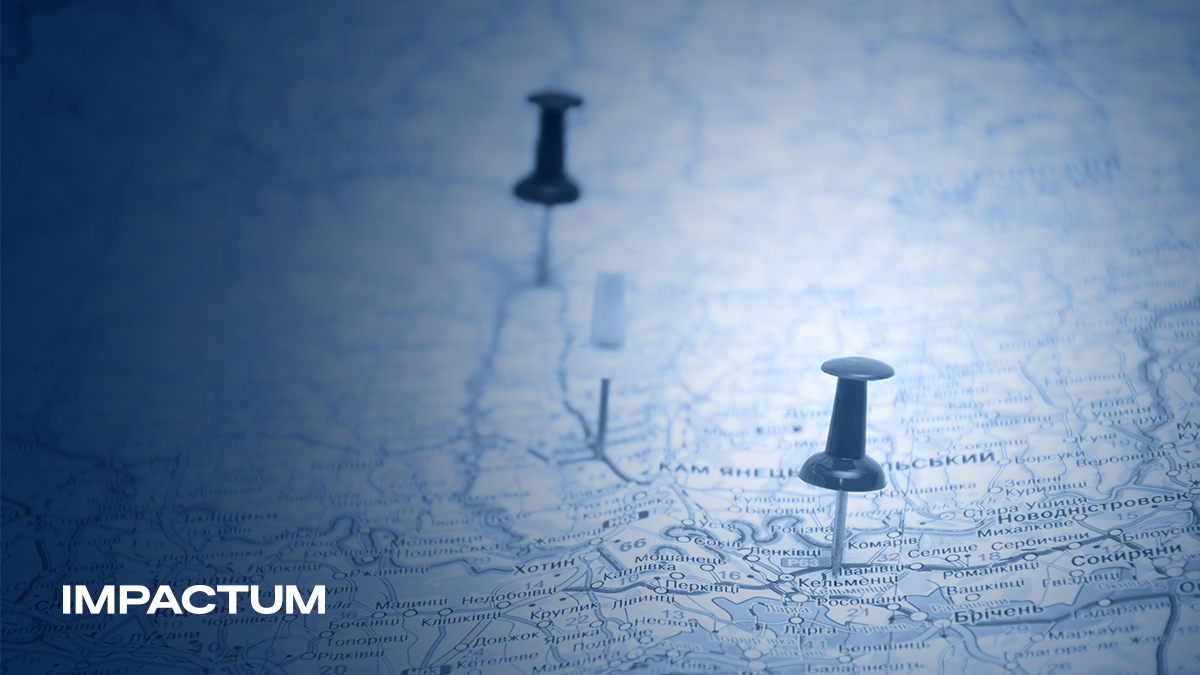
A national average can tell one story. A regional map can reveal several.
The same figure may reflect very different realities across cities, regions or countries. Growth might be concentrated in a few urban centres. Public concern may be strongest in communities closest to an issue. A service that appears widely available may still be difficult to access in particular areas.
Geography adds context to information-and that context can change how we interpret it.
What the numbers alone can miss
Tables help us compare values. Maps help us see how those values relate to place.
They can reveal concentrations, gaps and patterns that are difficult to recognise in a spreadsheet. Two regions with similar results may be far apart or may share a border. A trend that looks widespread may actually be clustered around a small number of locations.
Consider a hypothetical survey showing moderate concern about transport nationwide. A regional view might reveal much stronger concern in areas with limited connections to employment centres. That distinction changes both the questions an organisation should ask and the messages it should prioritise.
Why place matters for communication
Communication strategies often begin with a broad definition of the audience. Yet people’s experiences are shaped by where they live, the infrastructure around them and their proximity to events.
A message that feels relevant in one region may need a different emphasis elsewhere. Understanding these differences helps teams choose local examples, identify where additional explanation is needed and make national narratives more meaningful to specific communities.
The geographic perspective at the heart of The World in Maps offers a useful starting point: examining information in its geographic context to understand the relationships behind it.
From patterns to better questions
A map does not explain every pattern it reveals. Similar results in neighbouring areas do not necessarily have the same cause. Population size, measurement methods and the scale of the map all affect interpretation.
Its value lies in helping us ask better questions. Where is change concentrated? Which communities face different conditions? What gets lost when we rely on a single average?
For communication teams, those questions can lead to more informed priorities and more relevant storytelling.
Location is part of the story. Understanding it helps us tell that story more clearly.